
Canada Deposit Insurance Corporation Differential Premiums By-law
SCHEDULE 2(Sections 1, 6, 12, 15, 16 and 20 to 27)
PART 1Interpretation
- 1
(1) The following definitions apply in this Schedule:
- Guidelines
Guidelines means
(a) in the case of a bank, the Guidelines for Banks; and
(b) in the case of any other member institution, the Guidelines for Trust and Loan Companies. (Lignes directrices)
- regulated deposit-taking institution
regulated deposit-taking institution means an entity that is supervised or regulated by a Canadian or foreign financial services or banking regulator and is authorized to accept deposits from the public. (institution de dépôt réglementée)
(2) For the purposes of item 7 of the Reporting Form, the value of assets acquired by a member institution, as a result of a merger or an acquisition described in that item, is the value of the assets on the date of their acquisition as reported in the consolidated financial statements of the member institution.
PART 2Reporting Form
| 1 CAPITAL ADEQUACY MEASURES | |||
|---|---|---|---|
| 1.1 Assets to Capital Multiple | |||
| Formula: (Net on- and off-balance sheet assets) ÷ (Total Adjusted Net Tier 1 and Adjusted Tier 2 Capital) | |||
| Complete the following: (1.1.1 — — — —) ÷ (1.1.2 — — — —) = 1.1 | |||
| Elements Use the instructions below to arrive at the elements of the formula. Refer to the Basel II Capital Adequacy Reporting – Credit, Market and Operational Risk (BCAR) form, completed in accordance with Guideline A-1 of the Guidelines as of the end of the fiscal year ending in the year preceding the filing year. | |||
| 1.1.1 Net On- and Off-Balance Sheet Assets Indicate the net on- and off-balance sheet assets as set out for item “Q” of Schedule 1 – Ratio and Assets to Capital Multiple Calculations of the BCAR form. | |||
| 1.1.2 Total Adjusted Net Tier 1 and Adjusted Tier 2 Capital for Purposes of ACM Indicate the total adjusted net tier 1 and adjusted tier 2 capital for purposes of ACM as set out for item “U” of Schedule 1 – Ratio and Assets to Capital Multiple Calculations of the BCAR form. | |||
| 1.1.3 Multiple Authorized by the Regulator For a federal member institution, indicate the assets to capital multiple authorized by the institution’s regulator. For a provincial member institution, indicate the borrowing multiple or non-risk-weighted assets multiple authorized by the institution’s regulator. 1.1.3 | |||
| 1.2 Tier 1 Risk-Based Capital Ratio (%) | |||
| Formula: (Adjusted Net Tier 1 Capital) ÷ (Adjusted Risk-weighted Assets) × 100 | |||
| Complete the following: (1.2.1 — — — —) ÷ (1.2.2 — — — —) × 100 = 1.2 | |||
Elements Use the instructions below to arrive at the elements of the formula. Refer to the Basel II Capital Adequacy Reporting – Credit, Market and Operational Risk (BCAR) form, completed in accordance with Guideline A-1 of the Guidelines as of the end of the fiscal year ending in the year preceding the filing year. | |||
| 1.2.1 Adjusted Net Tier 1 Capital Indicate the adjusted net tier 1 capital as set out for item “A” of Schedule 1 – Ratio and Assets to Capital Multiple Calculations of the BCAR form. | |||
| 1.2.2 Adjusted Risk-Weighted Assets Indicate the adjusted risk-weighted assets as set out for item “D” of Schedule 1 – Ratio and Assets to Capital Multiple Calculations of the BCAR form. | |||
| 1.3 Total Risk-Based Capital Ratio (%) | |||
| Formula: (Total Capital) ÷ (Adjusted Risk-weighted Assets) × 100 | |||
| Complete the following: (1.3.1 — — — —) ÷ (1.3.2 — — — —) × 100 = 1.3 | |||
| Elements Use the instructions below to arrive at the elements of the formula. Refer to the Basel II Capital Adequacy Reporting – Credit, Market and Operational Risk (BCAR) form, completed in accordance with Guideline A-1 of the Guidelines as of the end of the fiscal year ending in the year preceding the filing year. | |||
| 1.3.1 Total Capital Indicate the total capital as set out for item “B” of Schedule 1 – Ratio and Assets to Capital Multiple Calculations of the BCAR form. | |||
| 1.3.2 Adjusted Risk-Weighted Assets Indicate the adjusted risk-weighted assets as determined for element 1.2.2. | |||
| 1.3.3 Required Total Risk-Based Capital Ratio Indicate the total risk-based capital ratio, or other similar ratio using risk-weighted assets, that is required by the member institution’s regulator for that institution. If the regulator does not assign a required ratio, indicate “N/A” (“not applicable”). 1.3.3 | |||
| Score | |||
Use the scoring grid below to determine the member institution’s capital adequacy score. If all the results for the member institution correspond to the range of results set out opposite a score, that score is the score to be assigned to the institution. If the results for the member institution do not all correspond to the range of results set out opposite a score, the lowest of the scores set out opposite each of the results that correspond to the institution’s results is the score to be assigned to the institution. | |||
| Range of Results | |||
| Assets to Capital Multiple | Tier 1 Risk-Based Capital Ratio | Total Risk-Based Capital Ratio | Score |
Assets to capital multiple (1.1) is ≤ the multiple authorized by the regulator (1.1.3) | Tier 1 risk-based capital ratio (1.2) is ≥ 7% | Total risk-based capital ratio (1.3) is: when the member institution does not indicate “N/A” for the required total risk-based capital ratio (1.3.3) and the required ratio is > 8%, ≥ 125% of the required ratio and in all other cases, ≥ 10% | 20 |
Assets to capital multiple (1.1) is ≤ the multiple authorized by the regulator (1.1.3) | Tier 1 risk-based capital ratio (1.2) is ≥ 4% and < 7% | Total risk-based capital ratio (1.3) is: when the member institution does not indicate “N/A” for the required total risk-based capital ratio (1.3.3) and the required ratio is > 8%, ≥ 100% and < 125% of the required ratio and in all other cases, ≥ 8% and < 10% | 13 |
Assets to capital multiple (1.1) is > the multiple authorized by the regulator (1.1.3) | Tier 1 risk-based capital ratio (1.2) is < 4% | Total risk-based capital ratio (1.3) is: when the member institution does not indicate “N/A” for the required total risk-based capital ratio (1.3.3) and the required ratio is > 8%, < 100% of the required ratio and in all other cases, < 8% | 0 |
| 1.4 Capital Adequacy Score | |||
| 2 RETURN ON RISK-WEIGHTED ASSETS (%) | |
|---|---|
Formula: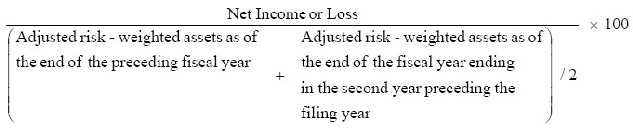 | |
| Complete the following: (2.1 — — — —) ÷ (( 2.2 — — — — + 2.3 — — — — ) / 2) × 100 = 2 | |
| Elements Use the instructions below to arrive at the elements of the formula. Refer to the following documents:
| |
| 2.1 Net Income or Loss The net income or loss attributable to equity holders and non-controlling interests (the latter to be reported as a negative number) is the amount set out in item 33 of the Consolidated Statement of Comprehensive Income, Retained Earnings and AOCI. | |
| 2.2 Adjusted Risk-Weighted Assets as of the End of the Preceding Fiscal Year Indicate the adjusted risk-weighted assets as determined for element 1.2.2. | |
| 2.3 Adjusted Risk-Weighted Assets as of the End of the Fiscal Year Ending in the Second Year Preceding the Filing Year Calculate the adjusted risk-weighted assets as of the end of the fiscal year ending in the second year preceding the filing year in the same manner as for element 2.2. If the member institution did not report its adjusted risk-weighted assets using the BCAR form as of the end of the fiscal year ending in the second year preceding the filing year, it must report the same amount as for element 2.2. If the member institution does not have a fiscal year ending in the second year preceding the filing year, it must report “zero”, unless it is an amalgamated institution described below. If the member institution is an amalgamated member institution formed by an amalgamation involving one or more member institutions and does not have a fiscal year ending in the second year preceding the filing year, it must report the same amount as for element 2.2. | |
| Score | |
| Use the scoring grid below to determine the member institution’s score. | |
| Range of results | Score |
| Return on risk-weighted assets (2) is ≥ 1.15 % | 5 |
| Return on risk-weighted assets (2) is ≥ 0.75 % and < 1.15 % | 3 |
| Return on risk-weighted assets (2) is < 0.75 % or a negative number (where 2.1 is a negative number) | 0 |
| 2.4 Return on risk-weighted assets score | |
| 3 MEAN ADJUSTED NET INCOME VOLATILITY | |
|---|---|
If a member institution has been operating as a member institution for less than five fiscal years consisting of at least 12 months each (with the fifth fiscal year ending in the year preceding the filing year), it must indicate “N/A” (“not applicable”) for elements 3, 3.1, 3.2 and 3.8 and fill in any of elements 3.3 to 3.7 that apply to it. If a member institution formed by an amalgamation involving only one member institution has been operating as a member institution for less than three fiscal years consisting of at least 12 months each (with the third fiscal year ending in the year preceding the filing year), in addition to filling in the applicable elements as an amalgamated member institution, it must also fill in the applicable elements for the amalgamating member institution. If a member institution formed by an amalgamation involving two or more member institutions has been operating as a member institution for less than three fiscal years consisting of at least 12 months each (with the third fiscal year ending in the year preceding the filing year), it must indicate “N/A” (“not applicable”) for elements 3, 3.1, 3.2 and 3.8 and fill in any of elements 3.3 to 3.7 that apply to it. | |
| Formula: (Semi-deviation of the net income or loss) ÷ (Mean net income or loss) | |
| Complete the following: (3.1 — — — —) ÷ (3.2 — — — —) = 3 | |
| Elements Use the instructions below to arrive at the elements of the formula. | |
| 3.1 Semi-deviation of the Net Income or Loss Determine the semi-deviation of the net income or loss using the formula 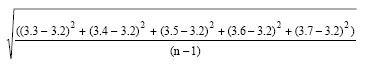 If 3.3 is ≥ 3.2, indicate “0” for (3.3 - 3.2), otherwise calculate as indicated. If 3.4 is ≥ 3.2, indicate “0” for (3.4 - 3.2), otherwise calculate as indicated. If 3.5 is ≥ 3.2, indicate “0” for (3.5 - 3.2), otherwise calculate as indicated. If 3.6 is ≥ 3.2, indicate “0” for (3.6 - 3.2), otherwise calculate as indicated. If 3.7 is ≥ 3.2, indicate “0” for (3.7 - 3.2), otherwise calculate as indicated. | |
| 3.2 Mean Net Income or Loss Determine the mean net income or loss (the latter to be reported as a negative number) using the formula ((3.3 + 3.4 + 3.5 + 3.6 + 3.7)) ÷ n If a member institution has been operating as a member institution for seven or more fiscal years consisting of at least 12 months each, “n” will be equal to 5. If a member institution has been operating as a member institution for six fiscal years consisting of at least 12 months each, “+ 3.7” must be removed from the formula and “n” will be equal to 4. If a member institution has been operating as a member institution for five fiscal years consisting of at least 12 months each, “+ 3.6 + 3.7” must be removed from the formula and “n” will be equal to 3. | |
| Net income or loss (the latter to be reported as a negative number) after tax for each of the last five fiscal years. Indicate the net income or loss as determined for element 2.1 for the fiscal year ending in the year preceding the filing year. Indicate the net income or loss after tax from the audited financial statements for the fiscal year preceding the fiscal year referred to in element 3.3. Indicate the net income or loss after tax from the audited financial statements for the fiscal year preceding the fiscal year referred to in element 3.4. Indicate the net income or loss after tax from the audited financial statements for the fiscal year preceding the fiscal year referred to in element 3.5. Indicate the net income or loss after tax from the audited financial statements for the fiscal year preceding the fiscal year referred to in element 3.6. Indicate the number of fiscal years that the member institution has been operating as a member institution (if less than 7). A member institution must report net income or loss for the last five fiscal years. If a member institution has been operating as a member institution for less than three fiscal years of at least 12 months each and it is a member institution formed by an amalgamation involving only one member institution, it must report the net income or loss of the amalgamating member institution for the three fiscal years or less preceding the amalgamation, as applicable. If a member institution has been operating as a member institution for less than five fiscal years of at least 12 months each, it must report “N/A” (“not applicable”) for the elements corresponding to the fiscal years for which it was not operating as a member institution. | |
| Score | |
| Use the scoring grid below to determine the member institution’s score. | |
| Range of results | Score |
| Mean adjusted net income volatility (3) is ≥ 0 and ≤ 0.4 | 5 |
| Mean adjusted net income volatility (3) is > 0.4 and ≤ 1.0 | 3 |
| Mean adjusted net income volatility (3) is > 1.0 | 0 |
| Mean adjusted net income volatility (3) is negative or the mean net income or loss (3.2) is “zero” | 0 |
| 3.8 Mean adjusted net income volatility score | |
| 4 STRESS-TESTED NET INCOME | |
|---|---|
If a member institution has reported “N/A” (“not applicable”) in element 3.8, it must report “N/A” for elements 4A, 4B and 4.3. | |
| Formulas: (Net income or loss) – (1.4 × Semi — deviation of the net income or loss) = (Stress — tested net income using 1.4 semi — deviations) (Net income or loss) – (2.8 × Semi — deviation of the net income or loss) = (Stress — tested net income using 2.8 semi — deviations) | |
| Complete the following: Stress-tested net income using 1.4 semi-deviations: 4.1 Stress-tested net income using 2.8 semi-deviations: 4.1 | |
| Elements Use the instructions below to arrive at the elements of the formulas. | |
| 4.1 Net Income or Loss Net income or loss as determined for element 2.1. | |
| 4.2 Semi-deviation of the Net Income or Loss The semi-deviation of the net income or loss as determined for element 3.1. | |
| Score | |
| Use the scoring grid below to determine the member institution’s score. | |
| Range of results | Score |
| Stress-tested net income using 2.8 semi-deviations (4B) is ≥ 0 | 5 |
| Stress-tested net income using 1.4 semi-deviations (4A) is ≥ 0, but stress-tested net income using 2.8 semi-deviations (4B) is < 0 | 3 |
| Stress-tested net income using 1.4 semi-deviations (4A) is < 0 | 0 |
| 4.3 Stress-tested net income score | |
| 5 EFFICIENCY RATIO (%) | |
|---|---|
| Formula: (Total non-interest expenses) ÷ (Net interest income + Non-interest income) × 100 | |
| Complete the following: (5.1 — — — —) ÷ (5.2 — — — — + 5.3 — — — — ) × 100 = 5 | |
| Elements Use the instructions below to arrive at the elements of the formula. Refer to the Consolidated Statement of Comprehensive Income, Retained Earnings and AOCI, Reporting Manual, “Income Statement” tab, completed in accordance with that Manual for the fiscal year ending in the year preceding the filing year. | |
| 5.1 Total Non-Interest Expenses Indicate the total non-interest expenses, as set out for item 26 of the Consolidated Statement of Comprehensive Income, Retained Earnings and AOCI, less any charges for impairment included under items 25(l)(i) and (ii) of that Statement. | |
| 5.2 Net Interest Income Determine the net interest income by adding (a) and (b): | |
|  |
| |
Total (insert as element 5.2 of the formula) | |
| 5.3 Non-Interest Income Determine the non-interest income by adding (a) and (b): | |
| |
| |
Total (insert as element 5.3 of the formula) | |
| Score | |
Use the scoring grid below to determine the member institution’s score. | |
| Range of results | Score |
| Efficiency ratio (5) is ≥ 0 or ≤ 65% | 5 |
| Efficiency ratio (5) is > 65% and ≤ 85% | 3 |
| Efficiency ratio (5) is > 85% or a negative number | 0 |
| 5.4 Efficiency ratio score | |
| 6 NET IMPAIRED ASSETS (INCLUDING NET UNREALIZED LOSSES ON SECURITIES) TO TOTAL CAPITAL (%) | ||||
|---|---|---|---|---|
| Formula: (Net impaired on-balance sheet assets + Net impaired off-balance sheet assets + Net unrealized losses on securities) ÷ (Total Capital) × 100 | ||||
| Complete the following: (6.1 — — — — + 6.2 — — — — + 6.3 — — — — ) ÷ (6.4 — — — —) × 100 = 6 | ||||
| Elements Use the instructions below to arrive at the elements of the formula. Refer to the following documents:
| ||||
| 6.1 Net Impaired On-Balance Sheet Assets Indicate the net impaired on-balance sheet assets as set out for the total of the column “Carrying Amount” in the Return of Impaired Assets. If the result is negative, report “zero”. | ||||
| 6.2 Net Impaired Off-Balance Sheet Assets Calculate the net impaired off-balance sheet assets by subtracting the total of the column “Specific allowance for impairment” in Table 6A from the total of the column “Credit equivalent” in that Table. If the result is negative, report “zero”. | ||||
| 6.3 Unrealized Losses on Securities Indicate the unrealized losses on investment book securities set out in the column “Total” for item 6 (Unrealized gain/loss on investment book securities) of Section I — Memo Items of the Consolidated Monthly Balance Sheet. If the result is a gain, report “zero”. | ||||
| 6.4 Total Capital Total capital as determined for element 1.3.1. |
Table 6A — Impaired Off-balance Sheet Assets
(Complete Table 6A as of the end of the fiscal year ending in the year preceding the filing year, referring to Schedule 39 – Off-balance Sheet Exposures Excluding Derivatives and Securitization Exposures and Schedule 40 – Derivative Contracts of the BCAR form, to Guideline A-1 of the Guidelines and to the Instructions to OSFI Capital Adequacy Return (effective Q1 2008).)
| Impaired Instruments | Notional principal amount | Credit conversion factor | Credit equivalent | Specific allowance for impairment |
|---|---|---|---|---|
| a | b | (a × b) | ||
| Direct credit substitutes – excluding credit derivatives | 100% | |||
| Transaction-related contingencies | 50% | |||
| Short-term self-liquidating trade-related contingencies | 20% | |||
| Sale & repurchase agreements | 100% | |||
| Forward asset purchases | 100% | |||
| Forward forward deposits | 100% | |||
| Partly paid shares and securities | 100% | |||
| NIFs & RUFs | 50% | |||
| Undrawn commitments – excluding securitization exposure | 0% | |||
| 20% | ||||
| 50% | ||||
| Impaired OTC Derivative Contracts | ||||
| Credit derivative contracts | Footnote for * | |||
| Interest rate contracts | Footnote for * | |||
| Foreign exchange & gold contracts | Footnote for * | |||
| Equity-linked contracts | Footnote for * | |||
| Precious metals (other than gold) contracts | Footnote for * | |||
| Other commodity contracts | Footnote for * | |||
| Total | ||||
| Use these totals to calculate element 6.2 | ||||
Return to footnote *Fill in the total amounts of the contracts under the heading “Credit equivalent amount” from Table 6B.
Table 6B — Impaired OTC Derivative Contracts
(Complete Table 6B as of the end of the fiscal year ending in the year preceding the filing year, referring to Schedule 39 – Off-balance Sheet Exposures Excluding Derivatives and Securitization Exposures and Schedule 40 – Derivative Contracts of the BCAR form, to Guideline A-1 of the Guidelines and to the Instructions to OSFI Capital Adequacy Return (effective Q1 2008).)
| Impaired OTC Derivative Contracts (in thousands of dollars) | Credit derivative contracts | Interest rate contracts | Foreign exchange & gold contracts | Equity-linked contracts | Precious metals (other than gold) contracts | Other commodity contracts |
| Replacement cost (market value) | ||||||
| a. Contracts held for trading purposes | ||||||
| (all contracts before permissible netting) |
| Gross positive replacement cost | ||||||
| Gross negative replacement cost |
| b. Contracts held for other than trading | ||||||
| (all contracts before permissible netting) |
| Gross positive replacement cost | ||||||
| Gross negative replacement cost |
| c. Contracts subject to permissible netting | ||||||
| (included in a and b above) |
| Gross positive replacement cost | ||||||
| Gross negative replacement cost | ||||||
| Net positive replacement cost |
| d. Total contracts – after permissible netting |
| Gross positive replacement cost |
| Potential credit exposure |
| Contracts not subject to permissible netting | ||||||
| Contracts subject to permissible netting |
| Credit equivalent amount | ||||||
| (after taking into account collateral and guarantees) |
| Contracts not subject to permissible netting | ||||||
| Contracts subject to permissible netting | ||||||
| Total Impaired OTC Derivative Contracts (carry forward to “Credit equivalent” column in Table 6A) |
| Score | |
|---|---|
| Use the scoring grid below to determine the member institution’s score. | |
| Range of results | Score |
| Net impaired assets (including net unrealized losses on securities) to total capital (6) is < 20% | 5 |
| Net impaired assets (including net unrealized losses on securities) to total capital (6) is ≥ 20% and < 40% | 3 |
| Net impaired assets (including net unrealized losses on securities) to total capital (6) is ≥ 40% | 0 |
| 6.5 Net impaired assets (including net unrealized losses on securities) to total capital score |
| 7 THREE-YEAR MOVING AVERAGE ASSET GROWTH (%) | |||
|---|---|---|---|
If a member institution has been operating as a member institution for less than six fiscal years consisting of at least 12 months each (with the sixth fiscal year ending in the year preceding the filing year), it must indicate “N/A” (“not applicable”) for element 7 but still fill in any of elements 7.1 to 7.4 that apply to it. If a member institution formed by an amalgamation involving only one member institution has been operating as a member institution for less than four fiscal years consisting of at least 12 months each (with the fourth fiscal year ending in the year preceding the filing year), in addition to filling in the applicable elements as an amalgamated member institution, it must also fill in the applicable elements for the amalgamating member institution. If a member institution formed by an amalgamation involving two or more member institutions has been operating as a member institution for less than four fiscal years consisting of at least 12 months each (with the fourth fiscal year ending in the year preceding the filing year), it must indicate “N/A” (“not applicable”) for elements 7 and 7.5 but still fill in any of elements 7.1 to 7.4 that apply to it. If a member institution acquires assets in the fiscal year ending in the year preceding the filing year as a result of a merger with or the acquisition of a regulated deposit-taking institution or as a result of the acquisition of the deposit-taking business of a regulated institution, and the value of those acquired assets on the date of their acquisition exceeds 10% of the value of the consolidated assets of the member institution immediately before that merger or acquisition, the member institution must include the value of those acquired assets in elements 7.1 to 7.3. | |||
Formula: | |||
Complete the following: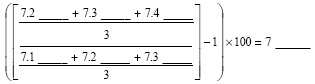 | |||
| Elements Use the instructions below to arrive at the elements of the formula. Refer to Section I of the Consolidated Monthly Balance Sheet, Reporting Manual, “Balance Sheet” tab, completed in accordance with that Manual as of the end of the fiscal year indicated under the heading “Assets for Years 1 to 4” below and to the Basel II Capital Adequacy Reporting – Credit, Market and Operational Risk (BCAR) form, completed in accordance with Guideline A-1 of the Guidelines as of the end of the fiscal year indicated under the heading “Assets for Years 1 to 4” below. | |||
| Assets for Years 1 to 4 For fiscal years ending in 2008, the total of
For fiscal years ending in 2009, the total of
| |||
For fiscal years ending in 2010, the total of
| |||
For fiscal years ending in 2011 or later, the total of
| |||
| Year 1: | as of the end of the fiscal year ending in the fourth year preceding the filing year | 7.1 | |
| Year 2: | as of the end of the fiscal year ending in the third year preceding the filing year | 7.2 | |
| Year 3: | as of the end of the fiscal year ending in the second year preceding the filing year | 7.3 | |
| Year 4: | as of the end of the fiscal year ending in the first year preceding the filing year | 7.4 | |
| Indicate the number of fiscal years consisting of at least 12 months that the member institution has been operating as a member institution (if less than six). | |||
| |||
| A member institution must report assets for the last four fiscal years. | |||
| If a member institution has been operating as a member institution for less than four fiscal years of at least 12 months each and it is a member institution formed by an amalgamation involving only one member institution, it must report the assets of the amalgamating member institution for the four fiscal years or less preceding the amalgamation, as applicable. | |||
| If a member institution has been operating as a member institution for less than four fiscal years consisting of at least 12 months each, it must indicate “N/A” (“not applicable”) for the elements corresponding to the fiscal years for which it was not operating as a member institution. | |||
| Score | |||
| Use the scoring grid below to determine the member institution’s score. | |||
| Range of Results | Score | ||
| Three-year moving average asset growth is ≤ 20% (including negative results) | 5 | ||
| Three-year moving average asset growth is > 20% but ≤ 40% | 3 | ||
| Three-year moving average asset growth is > 40% | 0 | ||
| 7.5 Three-year moving average asset growth score | |||
| 8 REAL ESTATE ASSET CONCENTRATION |
|---|
| Threshold Formula: (Total Mortgage Loans) ÷ (Total Mortgage Loans + Total Non-Mortgage Loans + Total Securities + Total Acceptances) × 100 |
| Complete the following: (8.1 — — — —) ÷ (8.1 — — — — + 8.2 — — — — + 8.3 — — — — + 8.4 — — — —) × 100 = |
| Elements Use the instructions below to arrive at the elements of the threshold formula. Refer to Section I of the Consolidated Monthly Balance Sheet, Reporting Manual, “Balance Sheet” Tab, completed in accordance with that Manual as of the end of the fiscal year ending in the year preceding the filing year. |
| 8.1 Total Mortgage Loans The total mortgage loans is the total of the amounts set out in the column “Total” for item 3(b) (Mortgages, less allowance for impairment) of Section I of the Consolidated Monthly Balance Sheet, before deducting any allowance for impairment. |
| 8.2 Total Non-Mortgage Loans The total non-mortgage loans is the total of the amounts set out in the column “Total” for items 3(a)(i) to (v), (vii) and (viii) (Non-Mortgage Loans, less allowance for impairment) of Section I of the Consolidated Monthly Balance Sheet. |
| 8.3 Total Securities The total securities is the total of the amounts set out in the column “Total” for item 2(a) (Securities issued or guaranteed by Canada/Canadian Province/Canadian Municipal or School Corporation) and item 2(b) (Other securities, less allowance for impairment) of Section I of the Consolidated Monthly Balance Sheet. |
| 8.4 Total Acceptances The total acceptances is the total of the amounts set out in the column “Total” for item 4 (Customers liability under acceptances, less allowance for impairment) of Section I of the Consolidated Monthly Balance Sheet. |
If the result of the threshold formula is less than 10%, score five for element 8.5 and do not complete the rest of section 8. If that result is greater than or equal to 10%, complete the rest of section 8. |
| Fill in Table 8 using the definitions and instructions below. Refer to Section III of the Mortgage Loans Report, Reporting Manual, “Mortgage Loans” Tab, completed in accordance with that Manual as of the end of the fiscal year ending in the year preceding the filing year. A member institution may complete these calculations using the information reported in the Mortgage Loans Report filed at its year-end or, if not filed at its year-end, at the calendar quarter-end preceding that year-end. |
| Fill in Table 8 for each of the following types of mortgages. |
| Residential Properties Mortgage Loans Mortgage loans of this type, secured by properties located in Canada, are to be classified in accordance with the instructions in the Reporting Manual. Calculate the total mortgage loans of this type by adding together the amounts set out for “Total Residential” in the columns “Insured Gross Mortgage Loans Outstanding” and “Uninsured Gross Mortgage Loans Outstanding”, respectively, in the first table of Section III of the Mortgage Loans Report, before deducting any allowance for impairment. |
| Land Banking and Development Mortgage Loans Mortgage loans of this type, secured by properties located in Canada, are to be classified in accordance with the instructions in the Reporting Manual. Calculate the total mortgage loans of this type by adding together the amounts set out for item 1(b)(ii)(C) (Land Banking & Development) in the columns “Insured Gross Mortgage Loans Outstanding” and “Uninsured Gross Mortgage Loans Outstanding”, respectively, in the first table of Section III of the Mortgage Loans Report, before deducting any allowance for impairment. |
| Hotel and Motel Properties Mortgage Loans Mortgage loans of this type, secured by properties located in Canada, are to be classified in accordance with the instructions in the Reporting Manual. Calculate the total mortgage loans of this type by adding together the amounts set out for item 1(b)(ii)(E) (Hotels/Motels) in the columns “Insured Gross Mortgage Loans Outstanding” and “Uninsured Gross Mortgage Loans Outstanding”, respectively, in the first table of Section III of the Mortgage Loans Report, before deducting any allowance for impairment. |
| Industrial Properties Mortgage Loans Mortgage loans of this type, secured by properties located in Canada, are to be classified in accordance with the Reporting Manual. Calculate the total mortgage loans of this type by adding together the amounts set out for item 1(b)(ii)(D) (Industrial Buildings) in the columns “Insured Gross Mortgage Loans Outstanding” and “Uninsured Gross Mortgage Loans Outstanding”, respectively, in the first table of Section III of the Mortgage Loans Report, before deducting any allowance for impairment. |
| Single Family Dwelling Properties Mortgage Loans Mortgage loans of this type, secured by properties located in Canada, are to be classified in accordance with the Reporting Manual. Calculate the total mortgage loans of this type by adding together the amounts set out for item 1(a)(i) (Single Detached) and item 1(a)(ii)(A) (Condominiums) in the columns “Insured Gross Mortgage Loans Outstanding” and “Uninsured Gross Mortgage Loans Outstanding”, respectively, in the first table of Section III of the Mortgage Loans Report, before deducting any allowance for impairment. |
| Residential Interim Construction Mortgage Loans Mortgage loans of this type, secured by properties located in Canada, are to be classified in accordance with the Reporting Manual. Calculate the total mortgage loans of this type by adding together the amounts set out for the element “Of Which Residential Interim Construction Mortgages” in the columns “Insured Gross Mortgage Loans Outstanding” and “Uninsured Gross Mortgage Loans Outstanding”, respectively, in the first table of Section III of the Mortgage Loans Report, before deducting any allowance for impairment. |
| Second or Subsequent Mortgage Loans Mortgage loans of this type, secured by properties located in Canada, are to be classified in accordance with the Reporting Manual. The total mortgage loans of this type is the amount set out for item 1 (Second and Subsequent Mortgages) in the column “Amounts Outstanding” in the second table of Section III of the Mortgage Loans Report, before deducting any allowance for impairment. |
| Real Estate Under Power of Sale or Foreclosed Properties Properties of this type, located in Canada, are to be classified in accordance with the Reporting Manual. Calculate by adding together
|
Table 8
| A | B | C | D | E |
|---|---|---|---|---|
| Type | Amount | Percentage of Total Mortgage Loans (Amount from Column B ÷ Total Mortgage Loans*) x 100 | Range of Results | ScoreFootnote for Table 8** |
| Residential Properties Mortgage Loans | < 50% = 0 ≥ 50% and < 75% = 3 ≥ 75% = 5 | |||
| Land Banking and Development Mortgage Loans | > 7% = 0 > 5% and ≤ 7% = 3 ≤ 5% = 5 | |||
| Hotel and Motel Properties Mortgage Loans | > 10% = 0 > 5% and ≤ 10% = 3 ≤ 5% = 5 | |||
| Industrial Properties Mortgage Loans | > 15% = 0 > 10% and ≤ 15% = 3 ≤ 10% = 5 | |||
| Single Family Dwelling Properties Mortgage Loans | < 35% = 0 ≥ 35% and < 50% = 3 ≥ 50% = 5 | |||
| Residential Interim Construction Mortgage Loans | > 8% = 0 > 5% and ≤ 8% = 3 ≤ 5% = 5 | |||
| Second or Subsequent Mortgage Loans | > 10% = 0 > 5% and ≤ 10% = 3 ≤ 5% = 5 | |||
| Real Estate Under Power of Sale or Foreclosed Properties | > 8% = 0 > 5% and ≤ 8% = 3 ≤ 5 % = 5 |
Return to footnote *“Total Mortgage Loans” used in the calculation in column C must correspond to the amount of the Total Mortgage Loans determined for element 8.1.
Return to footnote **Fill in the score in column E for a type of mortgage loan or property set out in column A that corresponds to the percentage set out in column C, in accordance with the appropriate range set out in column D.
| Score | |
|---|---|
| Use the scoring grid below to determine the member institution’s score. | |
| Results | Score |
| Lowest score in Column E of Table 8 is 0 | 0 |
| Lowest score in Column E of Table 8 is 3 | 3 |
| All scores in Column E of Table 8 are 5 | 5 |
| Result of the threshold formula is < 10% of Total Assets | 5 |
| 8.5 Real Estate Asset Concentration Score |
| 9 AGGREGATE COMMERCIAL LOAN CONCENTRATION RATIO (%) |
|---|
If the result of the threshold formula in section 8 is greater than 90%, indicate a score of five for element 9.4 and do not complete section 9. If the result of the threshold formula in section 8 is equal to or less than 90%, complete section 9. |
| Formula: (Aggregate Commercial Loan Concentration) ÷ (Total Capital) × 100 |
| Complete the following: (9.1 — — — —) ÷ (9.2 — — — —) × 100 = 9 |
| Elements Refer to Section 6 of the Non-Mortgage Loan Report, Reporting Manual, “Non-Mortgage Loans” Tab. Use the instructions below to arrive at the elements of the formula. A member institution may complete these calculations using the information reported in the Non-Mortgage Loan Report filed at its year-end or, if not filed at its year-end, at the calendar quarter-end preceding that year-end. |
| 9.1 Aggregate Commercial Loan Concentration The aggregate commercial loan concentration is the total of column B in Table 9, expressed in thousands of dollars. |
| 9.2 Total Capital The total capital as determined for element 1.3.1, expressed in thousands of dollars. |
| Fill in Table 9 following the instructions and using the definitions below. |
| Loans Loans are as described in the Non-Mortgage Loan Report |
| Person Means a natural person or an entity. |
| Entity Has the same meaning as in section 2 of the Bank Act. |
| Industry Sectors For the purpose of completing Table 9, commercial loans shall be grouped according to the classifications used for completing the Non-Mortgage Loan Report and using the 12 industry sectors in the list below. |
Industry Sector List
Calculate the commercial loans for each of the industry sectors in accordance with the following list and insert the total on the appropriate line in column A in Table 9. Refer to the Non-Mortgage Loan Report, Reporting Manual, “Non-Mortgage Loans” Tab. |
| Agriculture Commercial loans of this type are to be classified in accordance with the Reporting Manual. Calculate the total by adding together the amounts in the columns “Resident, Loan Balances, TC” and “Non-Resident, Loan Balances, TC” and subtracting the amount in the column “Total, Allowance for Impairment, TC”, all as set out for item 6.(b)(i) (Agriculture) in the Non-Mortgage Loan Report. |
| Fishing & Trapping Commercial loans of this type are to be classified in accordance with the Reporting Manual. Calculate the total by adding together the amounts in the columns “Resident, Loan Balances, TC” and “Non-Resident, Loan Balances, TC” and subtracting the amount in the column “Total, Allowance for Impairment, TC”, all as set out for item 6.(b)(ii) (Fishing & Trapping) in the Non-Mortgage Loan Report. |
| Logging & Forestry Commercial loans of this type are to be classified in accordance with the Reporting Manual. Calculate the total by adding together the amounts in the columns “Resident, Loan Balances, TC” and “Non-Resident, Loan Balances, TC” and subtracting the amount in the column “Total, Allowance for Impairment, TC”, all as set out for item 6.(b)(iii) (Logging & Forestry) in the Non-Mortgage Loan Report. |
| Mining, Quarrying & Oil Wells Commercial loans of this type are to be classified in accordance with the Reporting Manual. Calculate the total by adding together the amounts in the columns “Resident, Loan Balances, TC” and “Non-Resident, Loan Balances, TC” and subtracting the amount in the column “Total, Allowance for Impairment, TC”, all as set out for Sub-total 6.(b)(iv) (Mining, Quarrying & Oil Wells) in the Non-Mortgage Loan Report. |
| Manufacturing Commercial loans of this type are to be classified in accordance with the Reporting Manual. Calculate the total by adding together the amounts in the columns “Resident, Loan Balances, TC” and “Non-Resident, Loan Balances, TC” and subtracting the amount in the column “Total, Allowance for Impairment, TC”, all as set out for Sub-total 6.(b)(v) (Manufacturing) in the Non-Mortgage Loan Report. |
| Construction/Real Estate Commercial loans of this type are to be classified in accordance with the Reporting Manual. Calculate the total by adding together the amounts in the columns “Resident, Loan Balances, TC” and “Non-Resident, Loan Balances, TC” and subtracting the amount in the column “Total, Allowance for Impairment, TC”, all as set out for Sub-total 6.(b)(vi) (Construction/Real Estate) in the Non-Mortgage Loan Report. |
| Transportation, Communication & Other Utilities Commercial loans of this type are to be classified in accordance with the Reporting Manual. Calculate the total by adding together the amounts in the columns “Resident, Loan Balances, TC” and “Non-Resident, Loan Balances, TC” and subtracting the amount in the column “Total, Allowance for Impairment, TC”, all as set out for Sub-total 6.(b)(vii) (Transportation, Communication & Other Utilities) in the Non-Mortgage Loan Report. |
| Wholesale Trade Commercial loans of this type are to be classified in accordance with the Reporting Manual. Calculate the total by adding together the amounts in the columns “Resident, Loan Balances, TC” and “Non-Resident, Loan Balances, TC” and subtracting the amount in the column “Total, Allowance for Impairment, TC”, all as set out for Sub-total 6.(b)(viii) (Wholesale Trade) in the Non-Mortgage Loan Report. |
| Retail Commercial loans of this type are to be classified in accordance with the Reporting Manual. Calculate the total by adding together the amounts in the columns “Resident, Loan Balances, TC” and “Non-Resident, Loan Balances, TC” and subtracting the amount in the column “Total, Allowance for Impairment, TC”, all as set out for Sub-total 6.(b)(ix) (Retail) in the Non-Mortgage Loan Report. |
| Service Commercial loans of this type are to be classified in accordance with the Reporting Manual. Calculate the total by adding together the amounts in the columns “Resident, Loan Balances, TC” and “Non-Resident, Loan Balances, TC” and subtracting the amount in the column “Total, Allowance for Impairment, TC”, all as set out for Sub-total 6.(b)(x) (Service) in the Non-Mortgage Loan Report. |
| Multiproduct Conglomerates Commercial loans of this type are to be classified in accordance with the Reporting Manual. Calculate the total by adding together the amounts in the columns “Resident, Loan Balances, TC” and “Non-Resident, Loan Balances, TC” and subtracting the amount in the column “Total, Allowance for Impairment, TC”, all as set out for Sub-total 6.(b)(xi) (Multiproduct Conglomerates) in the Non-Mortgage Loan Report. |
| Others (Private Not for Profit Institutions, Religious, Health & Educational Institutions) Commercial loans of this type are to be classified in accordance with the Reporting Manual. Calculate the total by adding together the amounts in the columns “Resident, Loan Balances, TC”” and “Non-Resident, Loan Balances, TC” and subtracting the amount in the column “Total, Allowance for Impairment, TC”, all as set out for item 6.(b)(xii) Others (Private Not for Profit Institutions, Religious, Health & Educational Institutions) in the Non-Mortgage Loan Report. |
Table 9
| Instructions | ||
|---|---|---|
Insert 10% of total capital as determined for element 1.3.1: In column A below, report the amount calculated in accordance with the instructions for each industry sector. In column B below, for each industry sector that has an amount reported in column A that
| ||
| Industry Sector | Column A | Column B (Column A minus element 9.3; if negative, report “0”) |
| Agriculture | ||
| Fishing & Trapping | ||
| Logging & Forestry | ||
| Mining, Quarrying & Oil Wells | ||
| Manufacturing | ||
| Construction / Real Estate | ||
| Transportation, Communication & Other Utilities | ||
| Wholesale Trade | ||
| Retail | ||
| Service | ||
| Multiproduct Conglomerates | ||
| Others (Private Not for Profit Institutions, Religious, Health & Educational Institutions | ||
| Total of Column B | ||
| Carry total of column B forward to element 9.1 | ||
| Score | ||
| Use the scoring grid below to determine the member institution’s score. | ||
| Range of Results | Score | |
| Result of the threshold formula in section 8 is > 90% | 5 | |
| Aggregate commercial loan Concentration Ratio (9) < 150% | 5 | |
| Aggregate commercial loan Concentration Ratio (9) ≥ 150% and < 350% | 3 | |
| Aggregate commercial loan Concentration Ratio (9) ≥ 350% | 0 | |
| 9.4 Aggregate commercial loan Concentration Ratio score | ||
| 10 TOTAL QUANTITATIVE SCORE | ||
|---|---|---|
Using the scores from each of the preceding sections, fill in the scoring grid below to determine the total quantitative score. | ||
| Factor | Element | Score |
| Capital Adequacy | 1.4 | |
| Return on Risk-Weighted Assets | 2.4 | |
| Mean Adjusted Net Income Volatility | 3.8 | |
| Stress-tested Net Income | 4.3 | |
| Efficiency Ratio | 5.4 | |
| Net Impaired Assets (Including Net Unrealized Losses on Securities) to Total Capital | 6.5 | |
| Three-Year Moving Average Asset Growth | 7.5 | |
| Real Estate Asset Concentration | 8.5 | |
| Aggregate Commercial Loan Concentration Ratio | 9.4 | |
| Subtotal | ||
If elements 3.8, 4.3 and 7.5 are all “N/A”, fill in the result determined in accordance with the following formula: (Subtotal / 45) x 15 If none of elements 3.8, 4.3 and 7.5 are “N/A”, fill in “zero”. If only element 7.5 is “N/A”, fill in the result determined in accordance with the following formula: (Subtotal / 55) x 5 | ||
| Total Quantitative Score | ||
The information provided in this Reporting Form is based on:
audited financial statements
unaudited financial statements
Certification
The Chief Financial Officer, or other authorized officer, ,
(Name of Officer)
by submitting this Reporting Form to the Canada Deposit Insurance Corporation, certifies that the information provided in this Reporting Form is correct and that it has been completed in accordance with the Canada Deposit Insurance Corporation Differential Premiums By-law.
| Date | Name of Member Institution |
Certification Relating to the Canada Deposit Insurance Corporation Data and System Requirements By-law
| , an authorized officer of | ||
| Name of Individual | Name of Member Institution |
hereby certifies that the Member Institution, on or before the filing date of this Reporting Form,
meets
does not meet
the requirements of subsections 3(1) and 4(1), (3), (4) and (5) of the Canada Deposit Insurance Corporation Data and System Requirements By-law.
- SOR/2000-38, ss. 3, 4(E), 5 to 9
- SOR/2001-24, ss. 1, 2
- SOR/2002-126, ss. 9 to 13
- SOR/2005-48, ss. 10 to 18
- SOR/2006-47, ss. 6, 7, 8(E), 9
- SOR/2007-26, ss. 3, 4
- SOR/2009-12, ss. 3 to 11
- SOR/2010-4, ss. 6 to 10
- SOR/2010-307, ss. 7, 8(E), 9 to 11
- SOR/2011-312, ss. 1 to 4
Page Details
- Date modified: